In the last article, we figured out how much SiteOne Landscape Supply is worth as a company. If you want a detailed explanation of the calculation steps, you can find it by clicking here. However, just knowing the company’s value isn’t enough. To really understand how it stands against other companies, we need more factors for comparison. That’s where multiples come in. I’ve explained the most common multiples in the industry in another article. As of July 31, 2023, I’ve calculated those multiples specifically for SiteOne Landscape Supply . Now, let’s break down the process of calculating these multiples for the company.
In finance, multiples are like measuring sticks used to check different aspects of how a company is doing. They help us figure out its value compared to similar companies in the same industry. There are two main types of multiples: Equity Multiples and Enterprise Multiples.
Equity multiples focus on certain measures related to stocks:
1. Price-to-Sales Ratio: This measures how much investors think a company is worth compared to its sales. It gives an idea of what people think about the company based on its sales, without getting into complicated financial details.
2. Price-to-Book Ratio: This compares the value of a company in the stock market to the value of its assets. It helps investors figure out if a stock is priced fairly considering the value of its assets.
3. P/E Ratio (Price-to-Earnings Ratio): This divides the company’s stock price by its earnings per share. It shows how much investors are willing to pay for each dollar the company earns, helping to understand if a stock is valued properly based on its earnings.
4. Dividend Yield: This divides the company’s dividend per share by its stock price. It shows how much return investors can get from dividends and helps them pick stocks that match their investment goals.
Enterprise multiples give a broader view of a company’s value:
1. EV/Revenue (Enterprise Value/Revenue): This divides a company’s overall value by its revenue. It’s useful for companies without profits or when looking at businesses that are growing quickly.
2. EV/EBIT (Enterprise Value/Earnings Before Interest and Taxes): This compares a company’s overall value with its earnings, helping to see if a stock might be too expensive or a good deal based on its profitability.
3. EV/EBITDA (Enterprise Value/Earnings Before Interest, Taxes, Depreciation, and Amortization): This considers earnings before certain expenses, giving insights into how well a company is running.
4. EV/EBITDAR (Enterprise Value/Earnings Before Interest, Taxes, Depreciation, Amortization, and Rental Costs): It includes rental costs, which is important in industries where leasing assets is common.
5. EV/Invested Capital: This divides the overall value of the company by the money it has invested. It’s often used in industries that need a lot of money for assets.
Understanding these measures requires knowing a lot about the company, its industry, and the financial situation. Investors use these measures to compare different stocks, looking for ones that might be undervalued for better returns or to make smart investment choices.
Before we start figuring out the various times that Brightview Holdings’ value is mentioned, let’s make a few things clear.
- To find out the price of one share, click here go to page 5 and look for the share price. According to Nasdaq, the share price of Brightview Holdings is $170.
- If you’re looking at yearly figures, refer to the 10K report. For quarterly numbers, check the 10Q Report.
- Now, since we’re working with calculations up to July 31, 2023, we need to calculate the Last Twelve Months (LTM) as of July 2, 2023, for items in the Income Statement. This is because the most recent reports available are for the June quarter which is ending on 2nd July’23, and we want to get a sense of the twelve months leading up to that date. More details about the concept of LTM numbers are explained further below.
Certain concepts also need to be understood:
1. Concept of LTM Numbers:
It stands for the Last Twelve Months. The calculation we do has always been for the last 12 months. So, standing on 31st Jul’23, the last twelve months would be formed when the period starts on 3rd Jul’22 and ends on 2nd Jun’23 because the latest numbers released as of 31st Jul’23 were June quarter which is ending on 2nd Jul’23. The company’s financial year ends on 2nd January, including numbers from 3rd January to 2nd January.
So to calculate numbers till 2nd Jul’23, six months of 2022 will have to be deducted from annual numbers, and six months numbers of 2023 will have to be added to annual numbers so that we get the latest 12 months’ numbers, which start from 3rd Jul’22 to 2nd Jul’23.
2. Difference between GAAP and non-GAAP Numbers:
In the ordinary course of action, a company has many expenses that are not recurring in nature but are taken into account while making the financial statements called GAAP numbers. So the company adds back all the non-recurring and non-cash expenses it reduced while calculating EBIT (e.g. inventory write-downs, COVID-related expenses, Business transformation and integration costs, Offering-related expenses) and reduces back all the non-recurring incomes added while calculating EBIT (e.g. Insurance claims, government grants, disposal of assets). When these adjustments are made, the final amount comes under non-GAAP numbers.


Equity Multiples
Equity multiples are essential figures for investors to assess a company’s value and performance. The price-to-sales ratio indicates how the market values the company relative to its sales, providing insights into investor sentiments based on revenue. The price-to-book ratio compares market value to the company’s asset value, assisting in determining if a stock is appropriately priced considering its assets.
The P/E Ratio evaluates the share price in relation to earnings per share, revealing the significance investors place on the company’s earnings. Dividend Yield computes the return from dividends relative to the share price, aiding investors in selecting stocks aligned with their investment objectives.
- Price to Sales = Share Price / Total Sales
The multiple comprises two components, Share Price and Total Sales as of 31st Jul’23, which will be 2nd Jul’23 ending because the latest numbers released till 31st Jul’23 were for the quarter ending 2nd Jul’23.
So, we’ll first look at the per-share price.
As per Nasdaq data, the Share price of SiteOne Landscape Supply is $170.


Because the numbers provided in yearly and quarterly reports are in millions, we will change the per-share information into millions as well. Therefore, the value will be $0.00017 million.
So, following the path mentioned above, we’ll calculate the LTM Revenue as of 31st Jul’23.
Go to page 8 of the 10Q Report and page 65 of the 10K Report. Look for the “Consolidated Statements of Operations” on both pages. In that statement, the first item is “Net service revenues.” Take the numbers for the six months ending on July 3, 2022, which is $2,021.9 Million, subtract it from the twelve months ending on January 1, 2023, which is $4,014.5 Million, and then add the numbers for the six months ending on July 2, 2023, which is $2,191.1 Million.

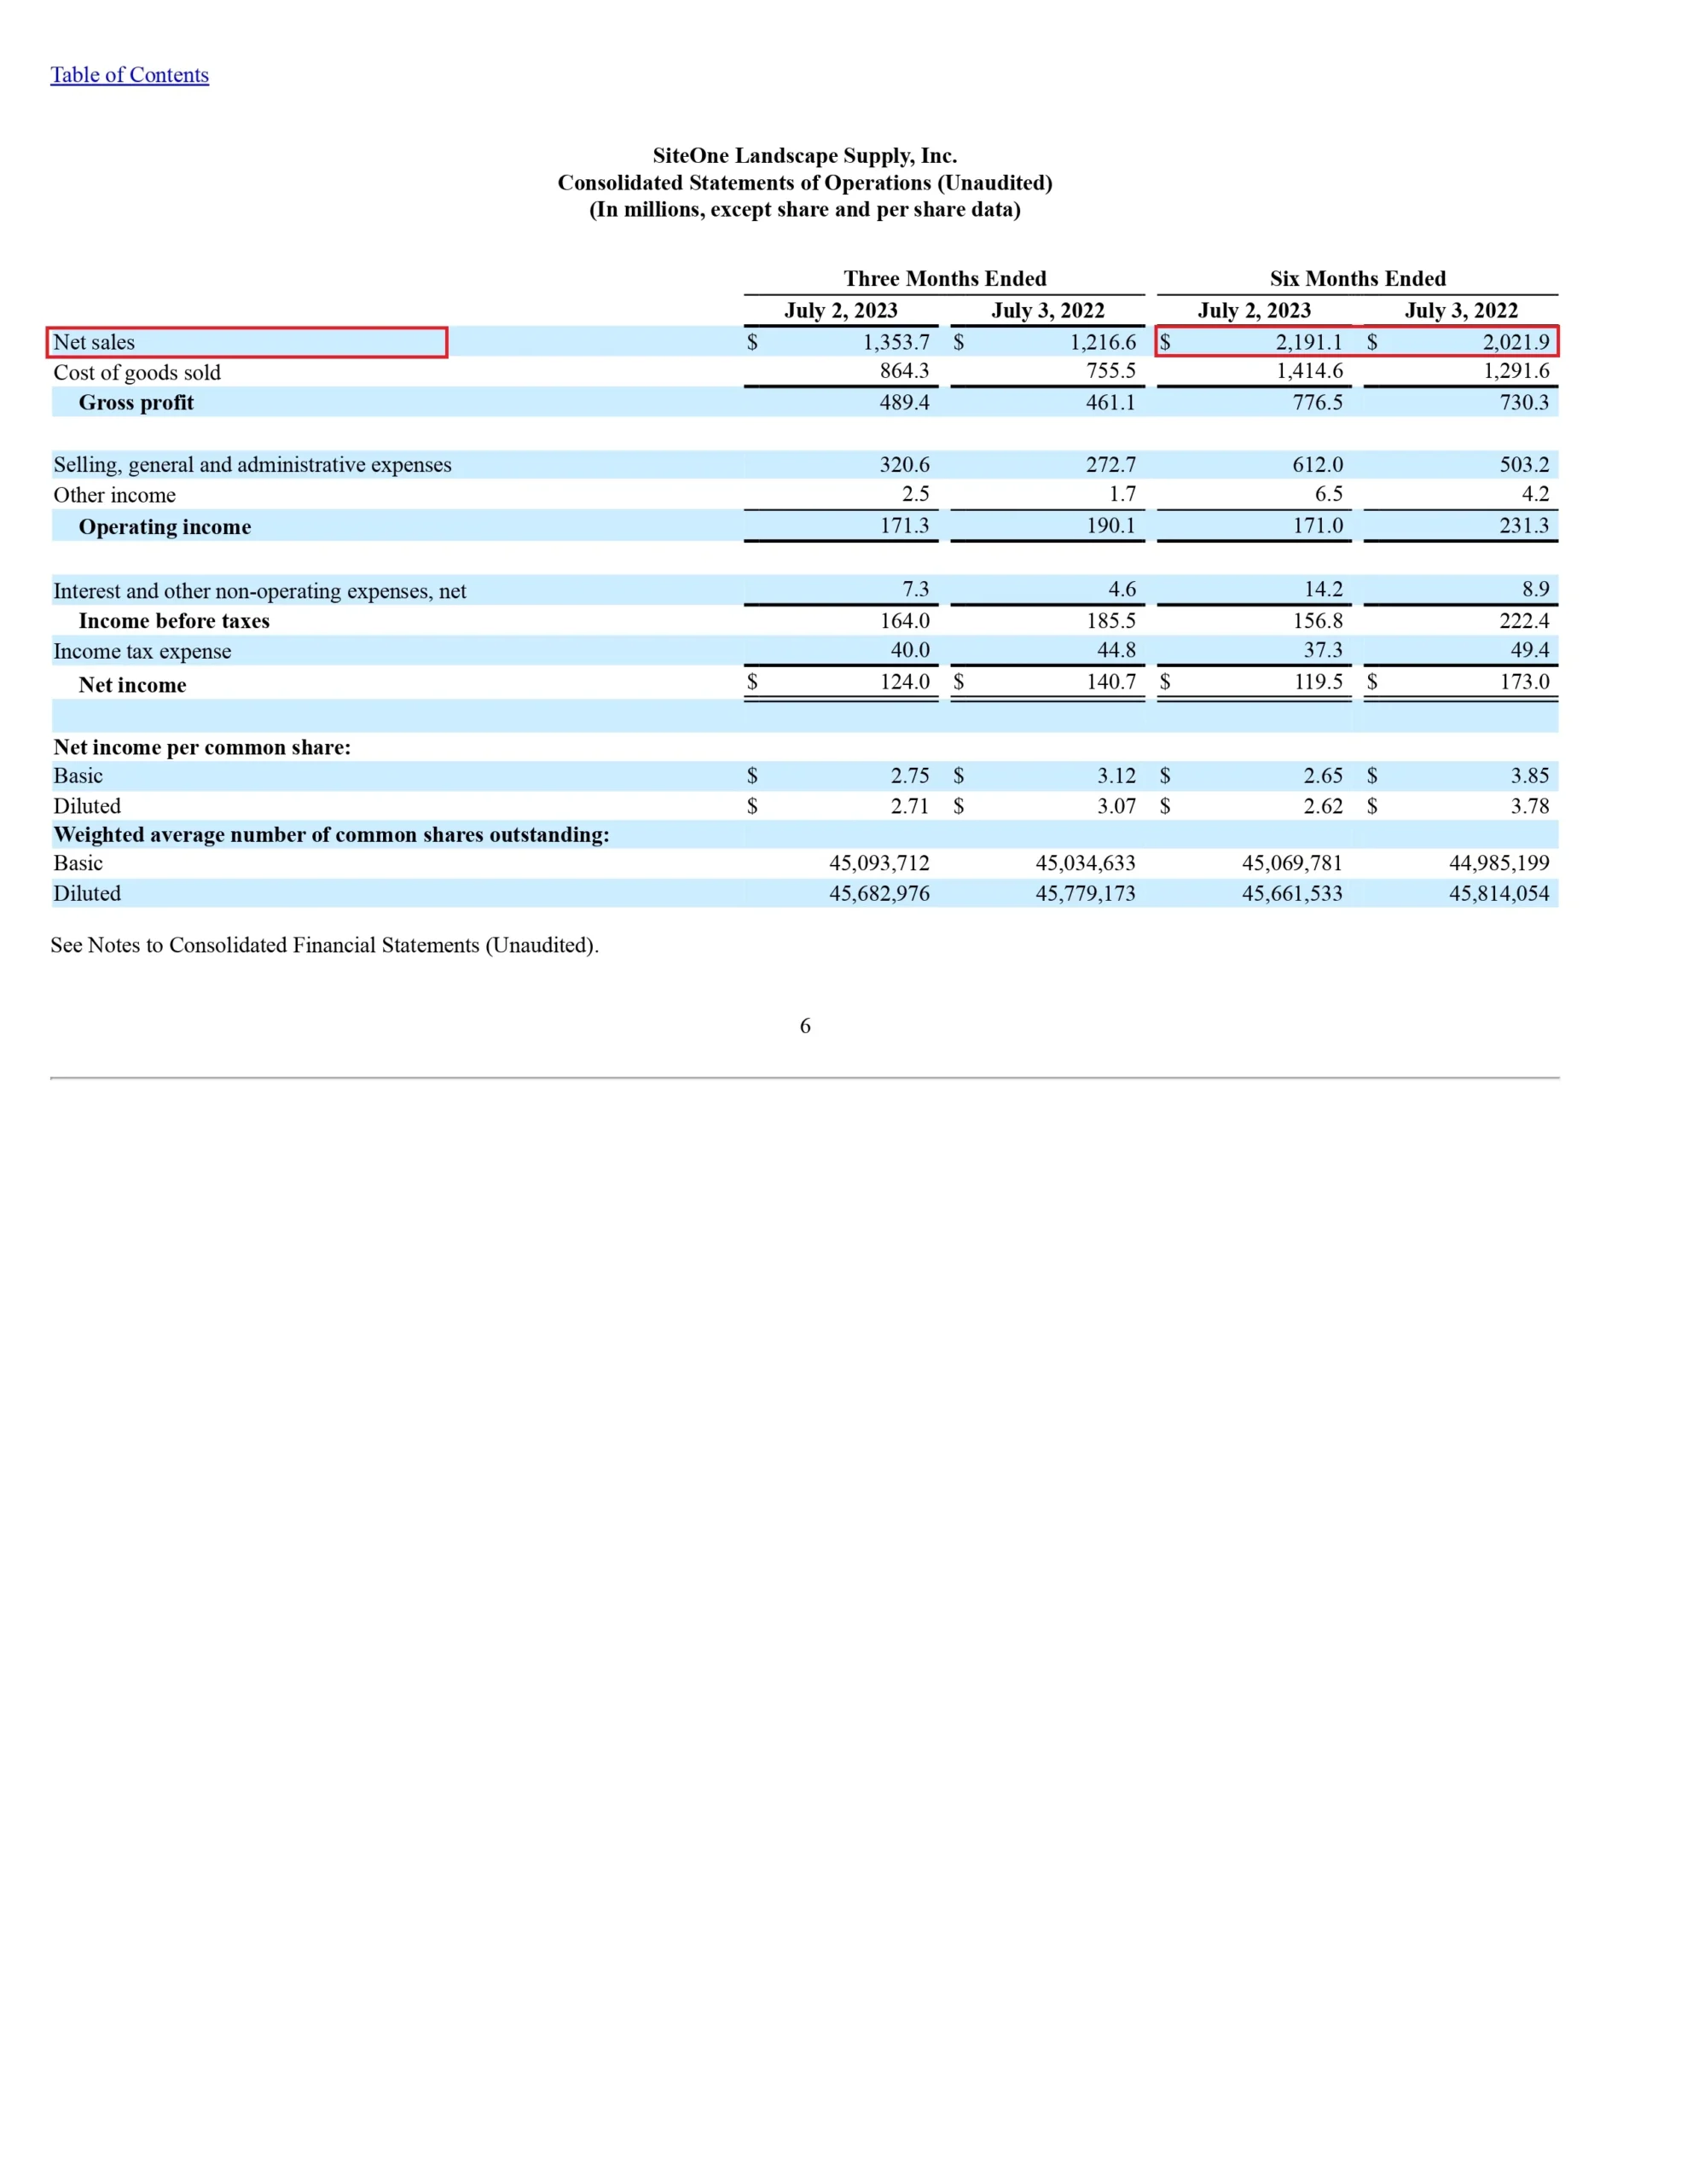
LTM Revenue as of 2nd Jul’23 = 12 months ending 1st Jan’23 – 9 months ending 3rd Jul’22 + 9 months ending 2nd Jul’23
= $4,014.5 Million – $2,021.9 Million + $2,191.1 Million
= $4183.7 Million
Since we have calculated the multiple components, we’ll now combine them.
Price to Sales = Share Price / Total Sales
= $0.00017 Million / $4183.7 Million
= 0.000000040633888663 x
2. Price-to-Book = Share Price/ Book Value of Assets
The multiple comprises two components, Share Price and Book Value of Assets as of 31st Jul’23, which will be 2nd Jul’23 ending because the latest numbers released till 31st Jul’23 were for the quarter ending 2nd Jul’23.
So, we’ll first look at the per-share price.
As per Nasdaq data, the Share price of SiteOne Landscape Supply is $170
Because the numbers in annual and quarterly reports are presented in millions, we will change the per-share data to millions as well. Therefore, the value will be $0.00017 million.
The book value of Assets can be calculated in two ways:
- Total Assets – Total Liabilities
Take Total Assets according to the latest consolidated balance sheet and deduct Total liabilities.
Visit page 7 of the 10Q Report, and you’ll find that the Total Assets are listed as $2,872.5 million, while the Total Liabilities are reported as $1,437.5 million.

Book value of Assets = Total Assets – Total Liabilities
= $2,872.5 Million – $1,437.5 Million
= $ 1,435 Million
- Shareholder’s Equity – Preferred Stock
Take the shareholders’ equity and deduct preferred stock from it.
Navigate to page 7 of the 10Q Report, and you’ll find that the Total Shareholder’s Equity is listed as $1,435.0 Million. The Preferred Stock value is not provided, indicating that the company doesn’t have any Preferred Stock. Therefore, we can consider the Preferred Stock value as $0 Million.
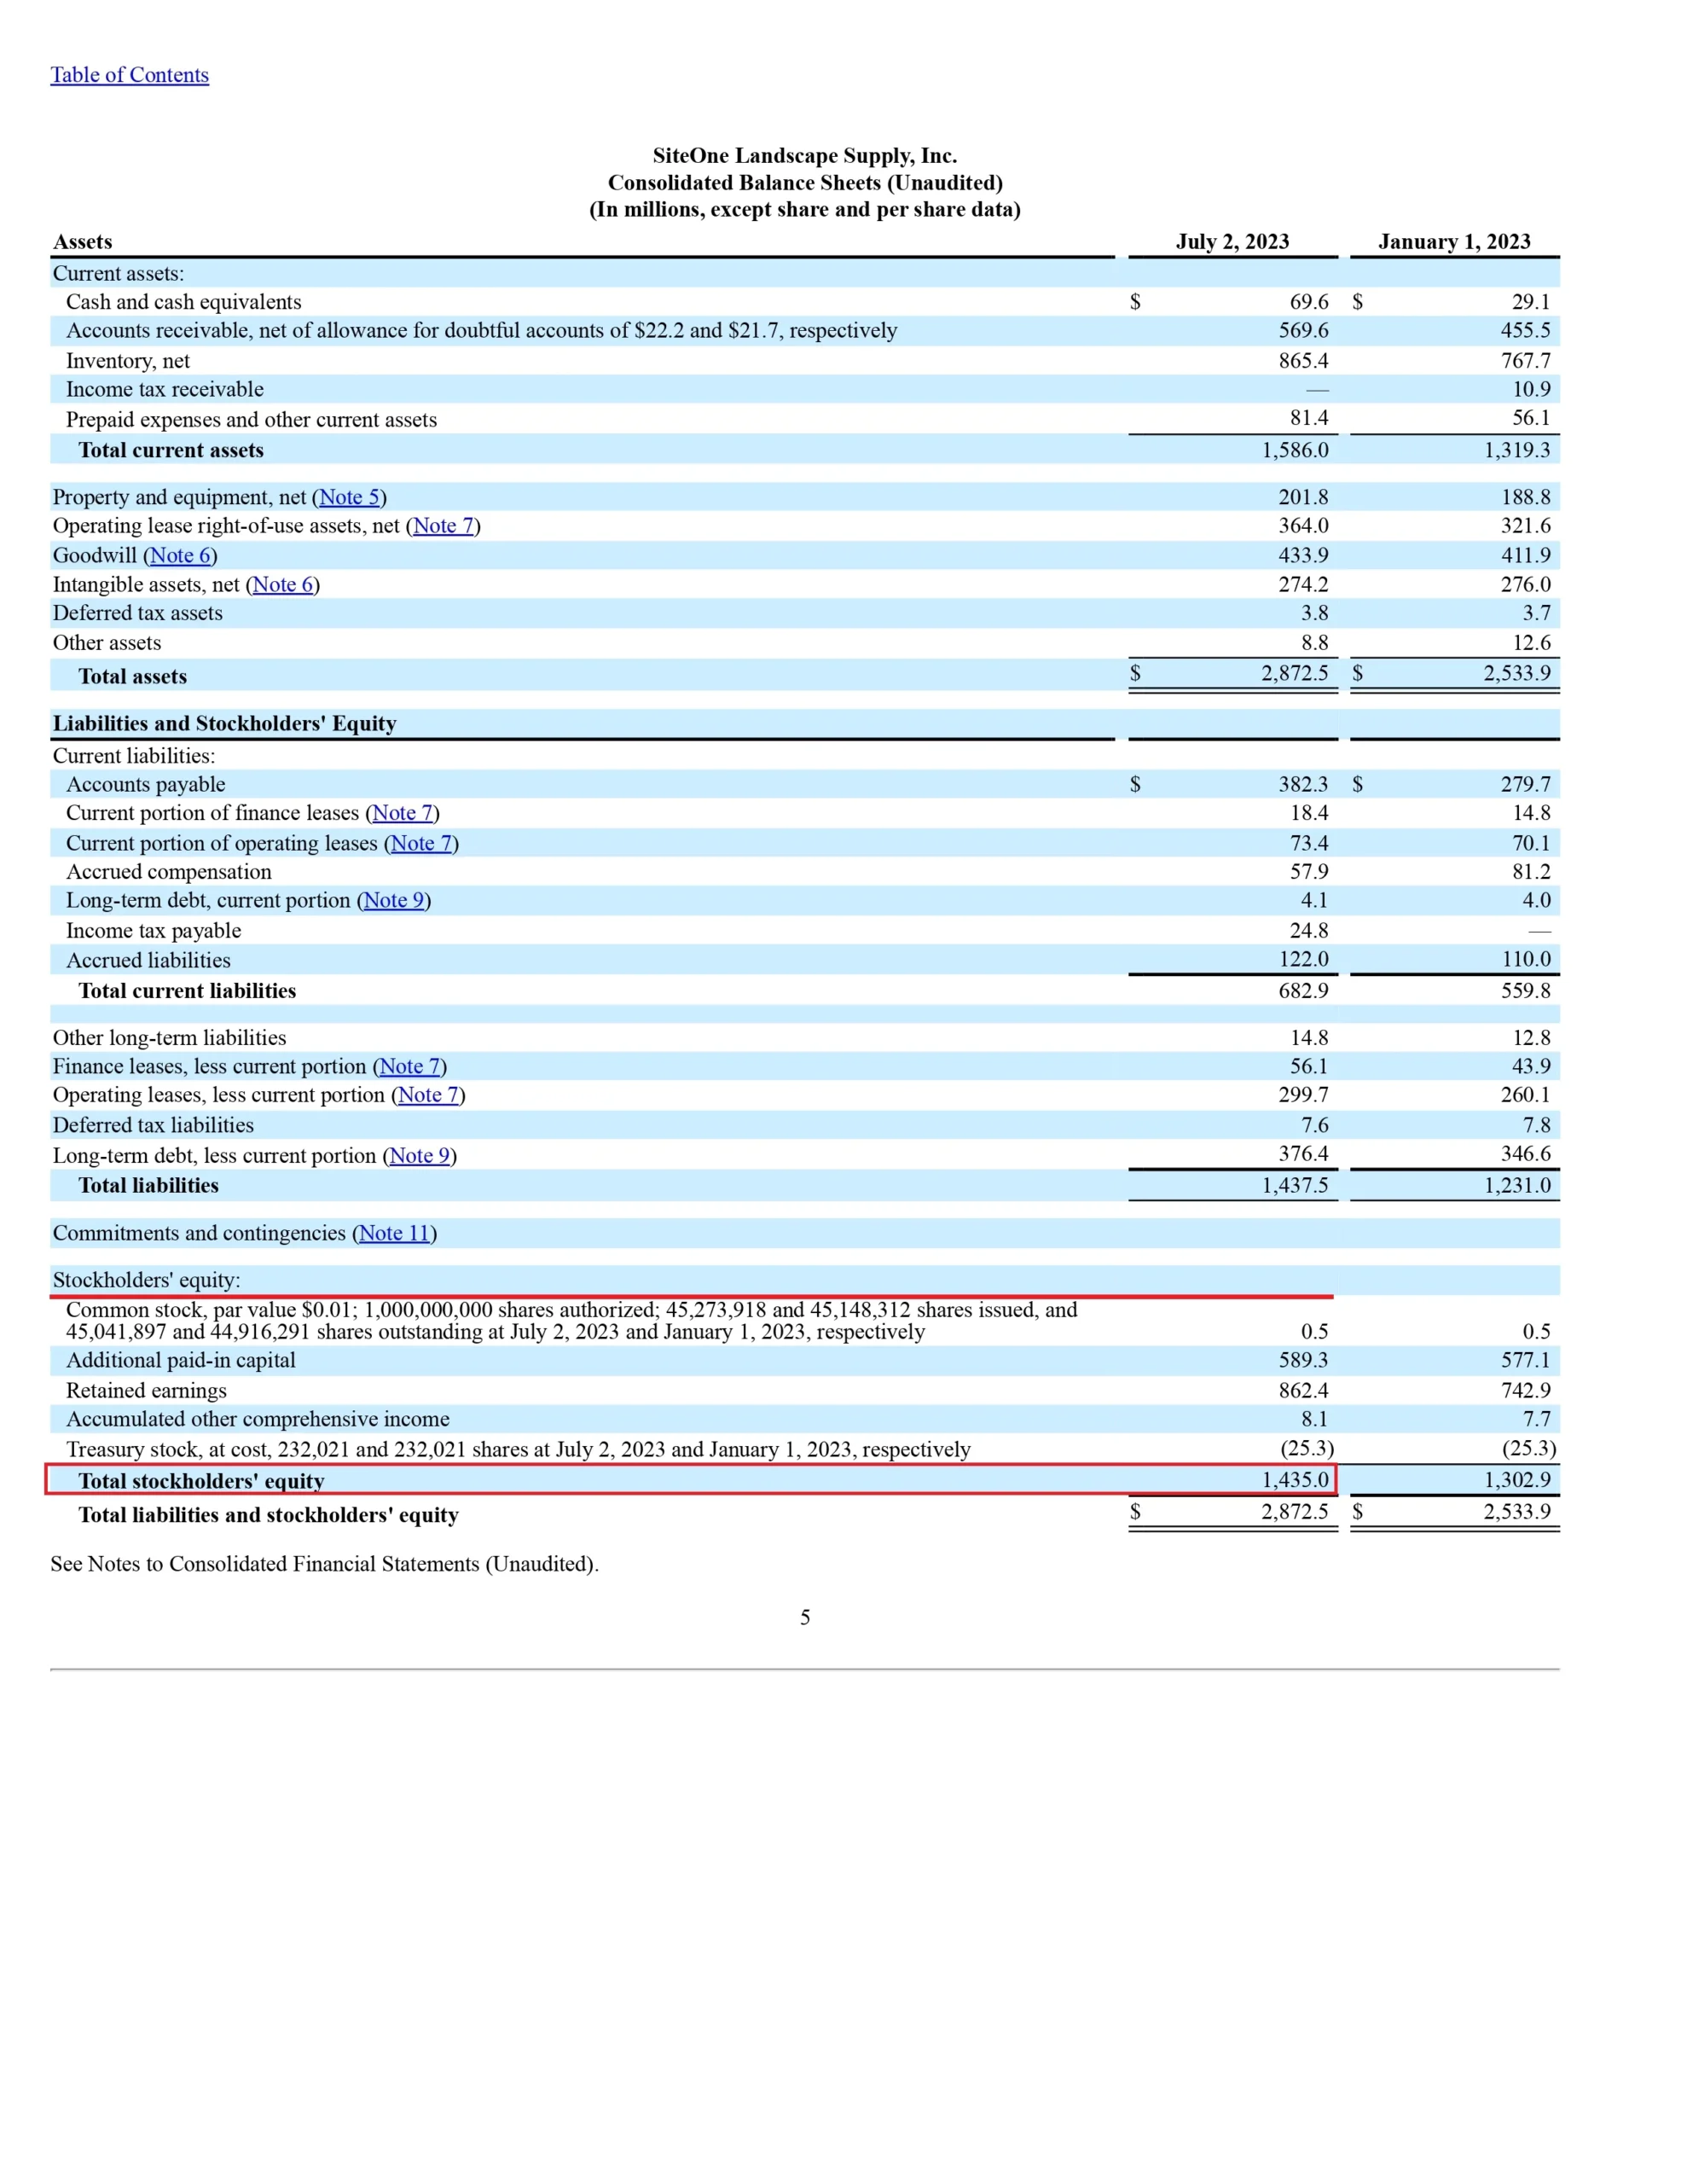
Book value of Assets = Shareholders’ equity – Preferred Stock
= $1,435.0 Million – $0 Million
= $1,435.0 Million
We can calculate the Book Value of Assets either way. The answer we’ll get will be identical.
Returning to the multiple, we now have both components, so let’s put the values together.
Price-to-Book = Share Price/ Book Value of Assets
= $0.00017 Million / $1,435.0 Million
= 0.000000118466898955 x
3. Price to Earnings = Share Price / Earning Per Share
The multiple comprises two components, Share Price and Book Value of Assets as of 31st Jul’23, which will be 2nd Jul’23 ending because the latest numbers released till 31st Jul’23 were for the quarter ending 2nd Jul’23.
So, we’ll first look at the per-share price.
As per Nasdaq data, the Share price of SiteOne Landscape Supply is $170
Since the numerator and denominator account for per-share data, we won’t convert Share price into Millions.
To find Earnings Per Share info, check page 8 in the 10Q Report and page 65 in the 10K Report. Look for “Consolidated Statements of Operations” on these pages in both reports. Focus on the last line, which mentions “(Loss) earnings per share: Basic and diluted (loss) earnings per share” – we’re interested in the Diluted figures.
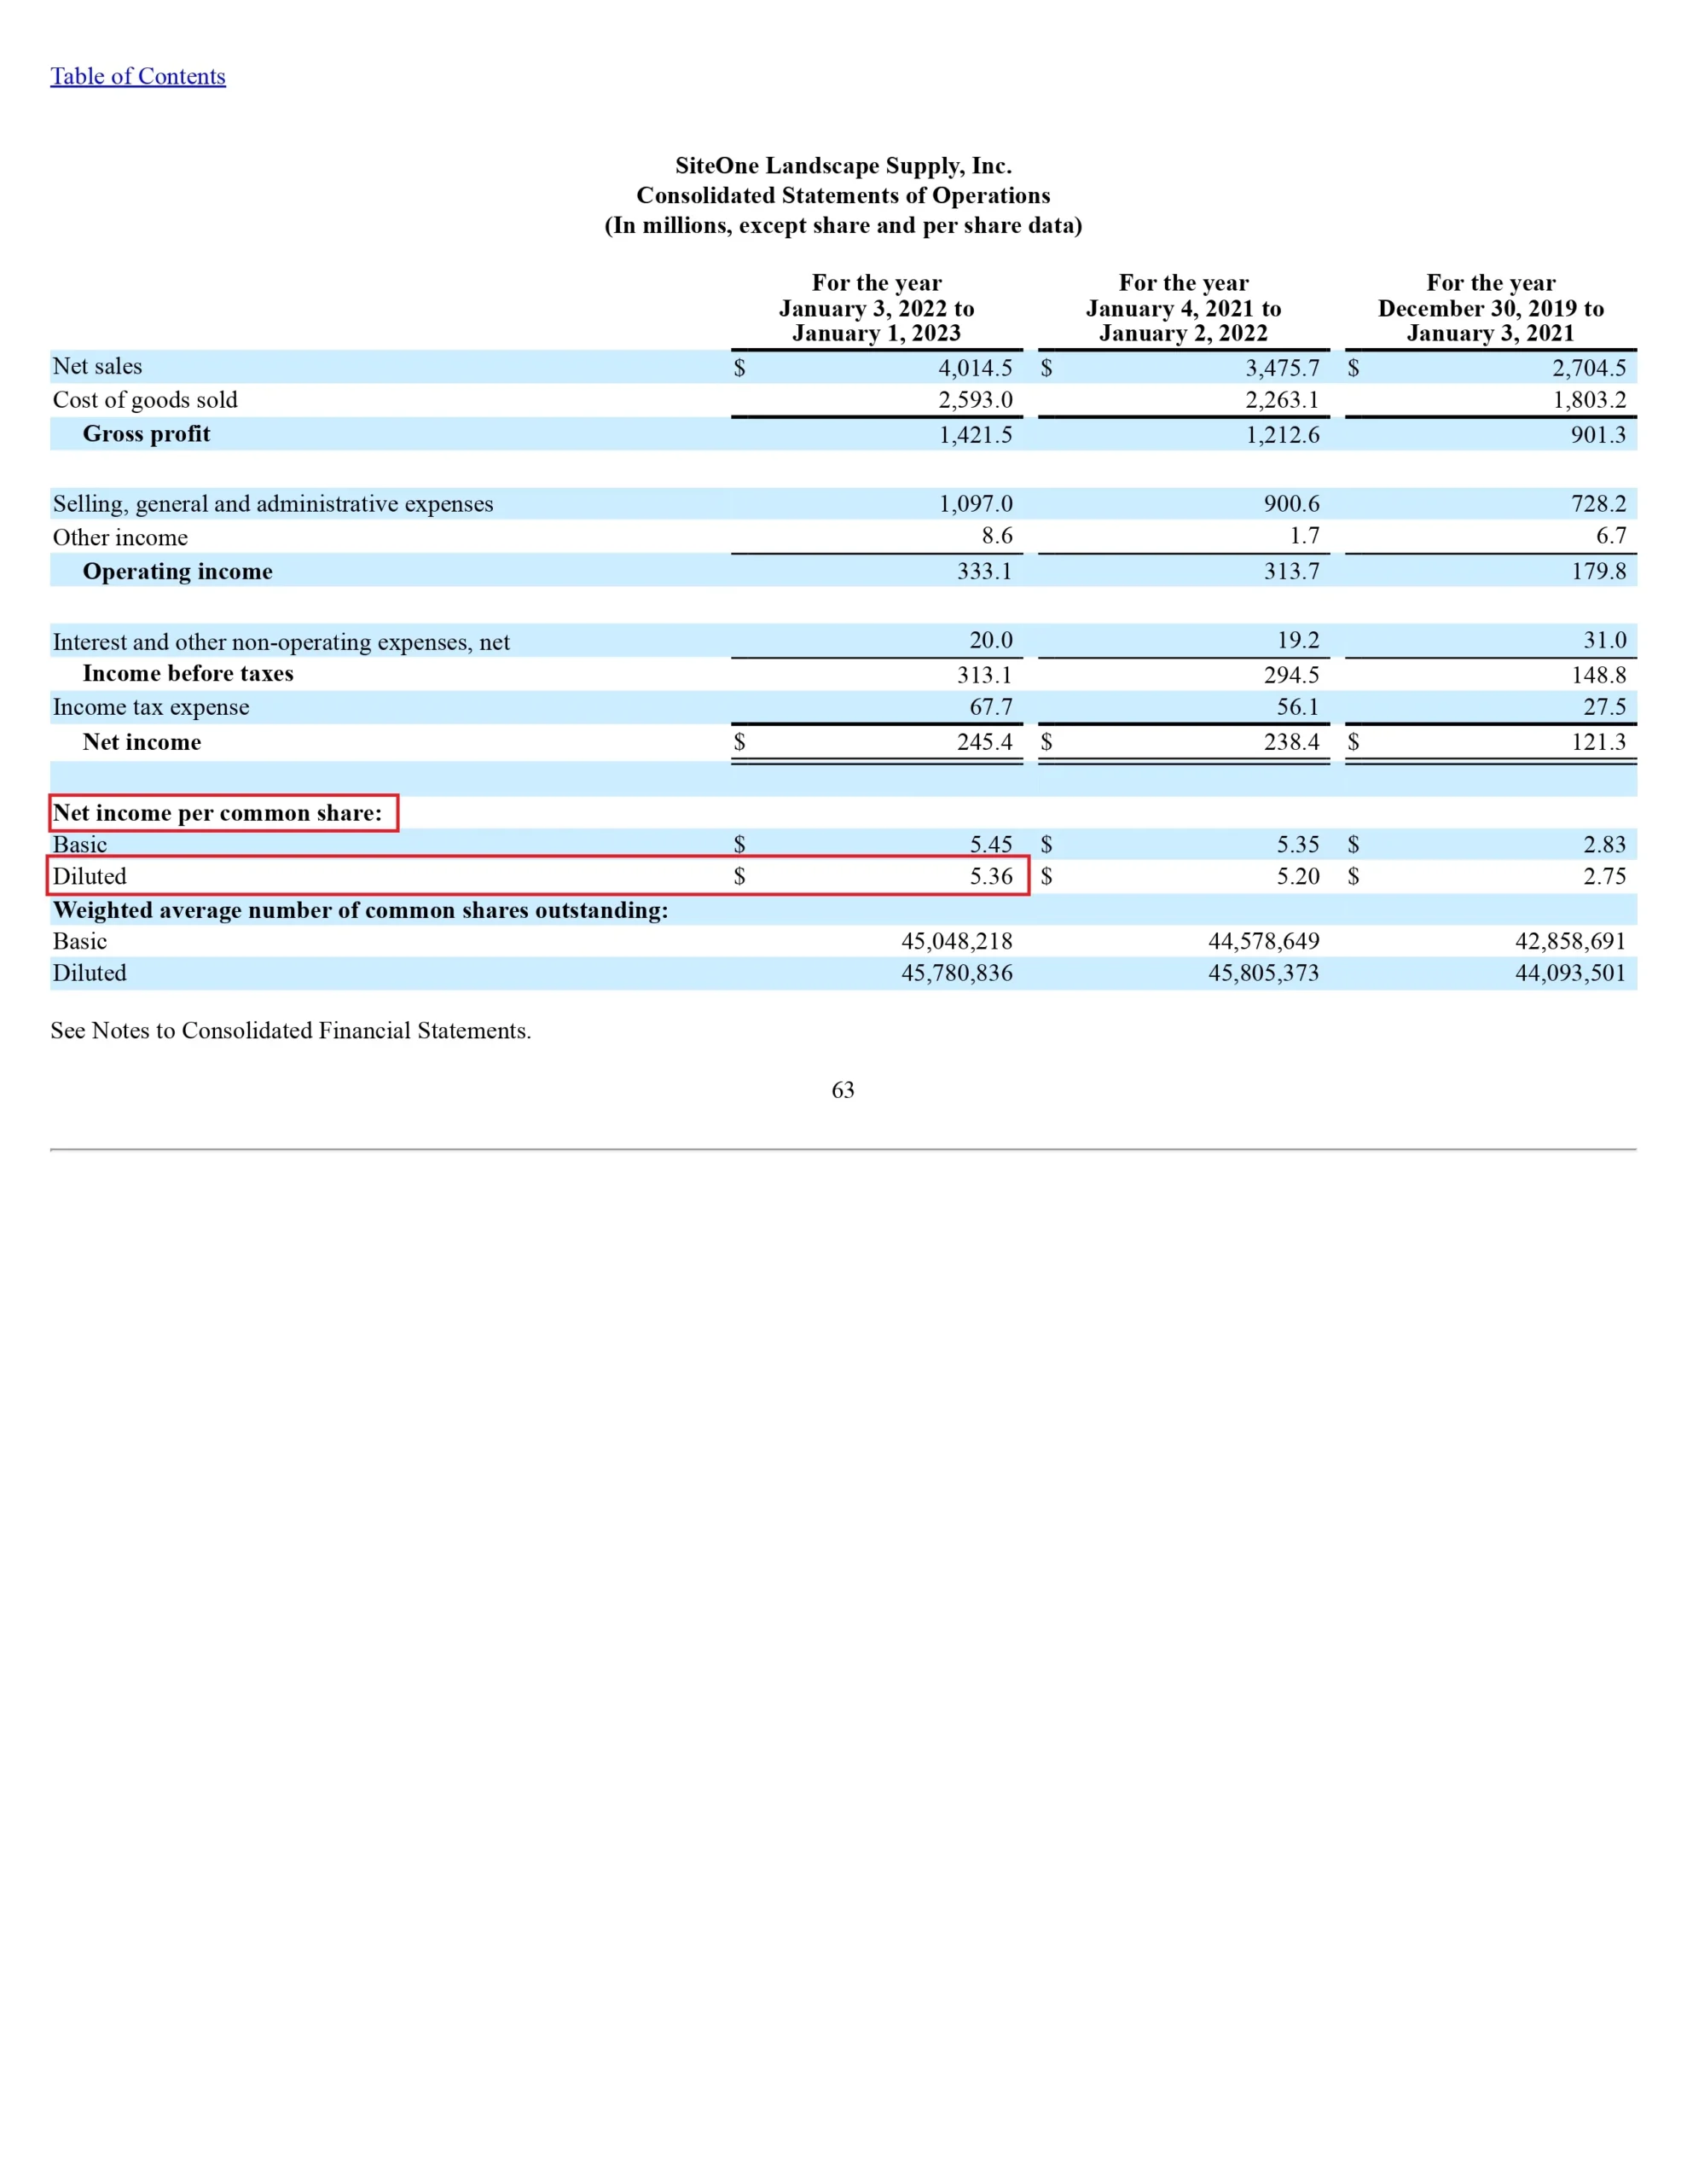

EPS for 2nd Jan’23 is $5.36, 3rd Jul’22 is $3.78 and 2nd Jul’23 is $2.62.
LTM EPS as of 2nd Jul’23 = 12 months annual nos. – 6 months ending 3rd Jul’22 +6 months ending 2nd Jul’23
= $5.36 – $3.78 + $2.62
= $4.2
Putting together the elements of the multiple,
Price to Earnings = Share Price / Earning Per Share
= $170 / $4.2
= 40.47619 x
4. Dividend Yield = Dividend Per Share / Price Per Share
This multiple has two parts: Dividend Per Share on top and Price Per Share on the bottom. To calculate it, we need the dividend amount the company announced, but there were no dividends declared by the company in 2021 and 2022.

The same note was seen in the annual reports of both years.
The common question at this stage is why we check the 10K report for the Fiscal year ending 2nd January 2022 and 1st January 2023.
So the answer to this question is that if I want to know if dividends were declared in 2023 in July, I’ll go back to the 10K report ending 1st January 2023, which would have this information because the company’s Fiscal year ends on 1st or 2nd January every year. But if I want to know whether dividends were declared in July 2022, I must return to the 10K report ending 2nd January 2022. That’s why we have to consider for financial reports ending Jan’22 and Jan’21.
Enterprise Multiples
Enterprise multiples are financial measures that help evaluate how much a company is worth compared to different aspects of its business. These measures include EV/Revenue, which looks at a company’s value relative to its revenue and is useful for high-growth businesses that may not be profitable yet. EV/EBIT compares a company’s value to its earnings before interest and taxes, helping assess if a stock is priced too high or too low based on its profitability.
EV/EBITDA evaluates a company’s operational efficiency by considering earnings before interest, taxes, depreciation, and amortization. For industries where leasing is common, EV/EBITDAR is relevant as it includes rental costs. Lastly, EV/Invested Capital assesses how efficiently a company is using its fixed assets by dividing its enterprise value by invested capital, commonly applied in capital-intensive sectors.
- EV/Revenue = Enterprise Value / Total Revenue
I have already calculated the Enterprise Value of Brightview Holding. We’ll simply fetch the value from there, i.e. $1,524.49 Million. If you want to understand how to calculate Enterprise Value step by step, click here.
For Revenue, we’ll have to calculate LTM Revenue, which will be:
Revenue 12 months ending as of 1st Jan’23 – Revenue 6 months ending 3rd Jul’22 + Revenue 9 months ending 2nd Jul’23.
Check out page 8 in the 10Q Report and page 65 in the 10K Report. Look for the “Consolidated Statements of Operations” on both pages. The first item listed is “Net service revenues.” Take the figures from the six months ending on July 3, 2022 (which is $2,021.9 Million), subtract that from the twelve months ending on January 1, 2023 (which is $4,014.5 Million), and then add the figures from the six months ending on July 2, 2023 (which is $2,191.1 Million).


LTM Revenue = $4,014.5 Million – $2,021.9 Million + $2,191.1 Million
= $4183.7 Million
Putting together the components of the multiple,
EV/Revenue = Enterprise Value / Total Revenue
= $1,524.49 Million / $4183.7 Million
= 0.36438 x
2. EV/EBIT = Enterprise Value / Earning Before Interest and Taxes
EV being, i.e. $1,524.49 Million, we’ll move further towards calculating LTM EBIT.
LTM EBIT = Revenue 12 months ending as of 1st Jan’23 – Revenue 6 months ending 3rd Jul’22 + Revenue 9 months ending 2nd Jul’23.
Go to page 8 in the 10Q Report and page 65 in the 10K Report. Look for the “Consolidated Statements of Operations” on both pages. On the sixth line of that statement, you’ll find “Operating income.”


Operating Income for 2nd Jan’23 is $333.1 Million, 3rd Jul’22 is $231.3 Million and 2nd Jul’23 is $171.0 Million
LTM EBIT = $333.1 Million – $231.3 Million + $171.0 Million
= $272.8 Million
EV/EBIT = Enterprise Value / Earning Before Interest and Taxes
= $1,524.49 Million / $272.8 Million
= 5.5883 x
In simpler terms, instead of using regular EBIT, we’ll use Adjusted EBIT for a more detailed assessment. Adjusted EBIT is chosen because it makes a company’s profits and expenses more consistent, considering that various companies may have unique types of spending.
If there’s any confusion, refer to the explanation of the variances between GAAP and non-GAAP numbers in the first section of the article, where essential concepts are discussed.
Coming back to the multiple,
The company discloses the Adjusted EBITDA in the financial statements. We can pick that and add Depreciation and Amortization to it.
LTM Adjusted EBIT = (12 months ending Adjusted EBITDA as of 2nd Jan’23 – (12 months ending Depreciation and Amortization as of 2nd Jan’23)) – (6 months ending Adjusted EBITDA as of 3rd Jul’22 – (6 months ending Depreciation and Amortization as of 3rd Jul’22)) – (6 months ending Adjusted EBITDA as of 2nd Jul’23 + (6 months ending Depreciation and Amortization as of 2nd Jul’23)).
The first one is,
12 months ending Adjusted EBITDA as of 2nd Jan’23 – (12 months ending Depreciation and Amortization as of 2nd Jan’23)
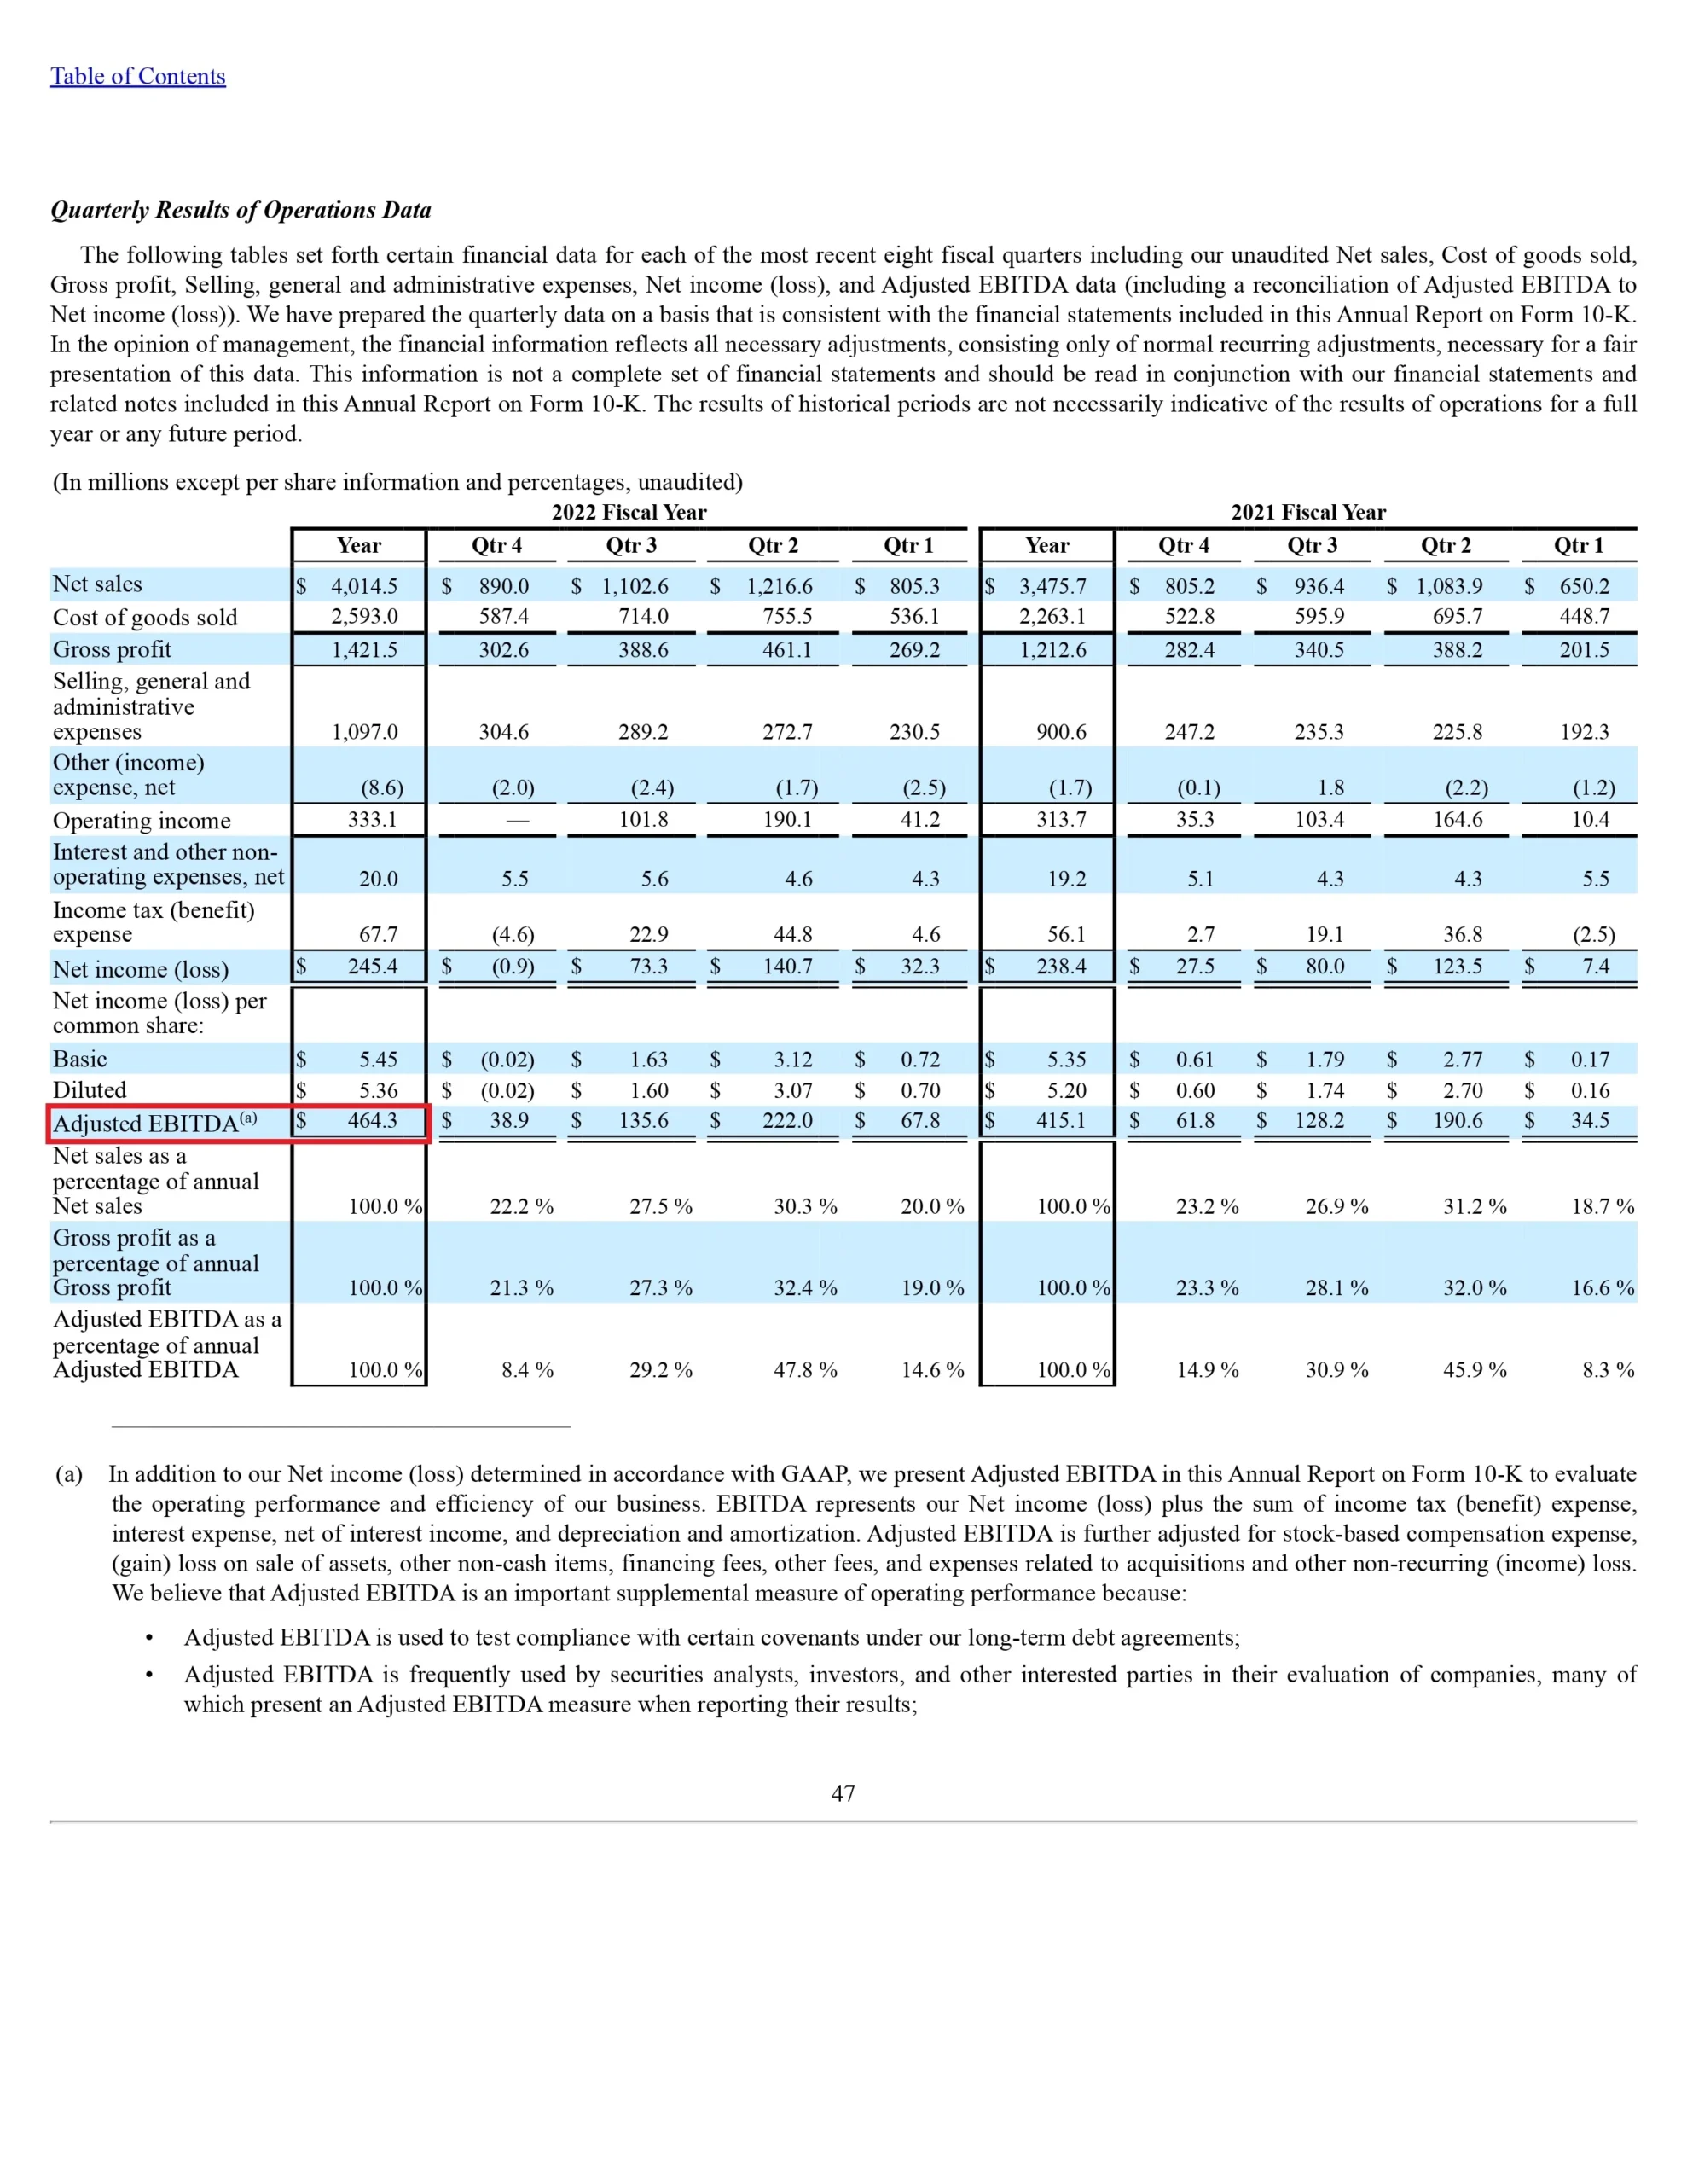
Visit page 49 of 10K report. The tables clearly show the values of Adjusted EBITDA, which are $464.3 Million for 12 months ending 2nd Jan’23.
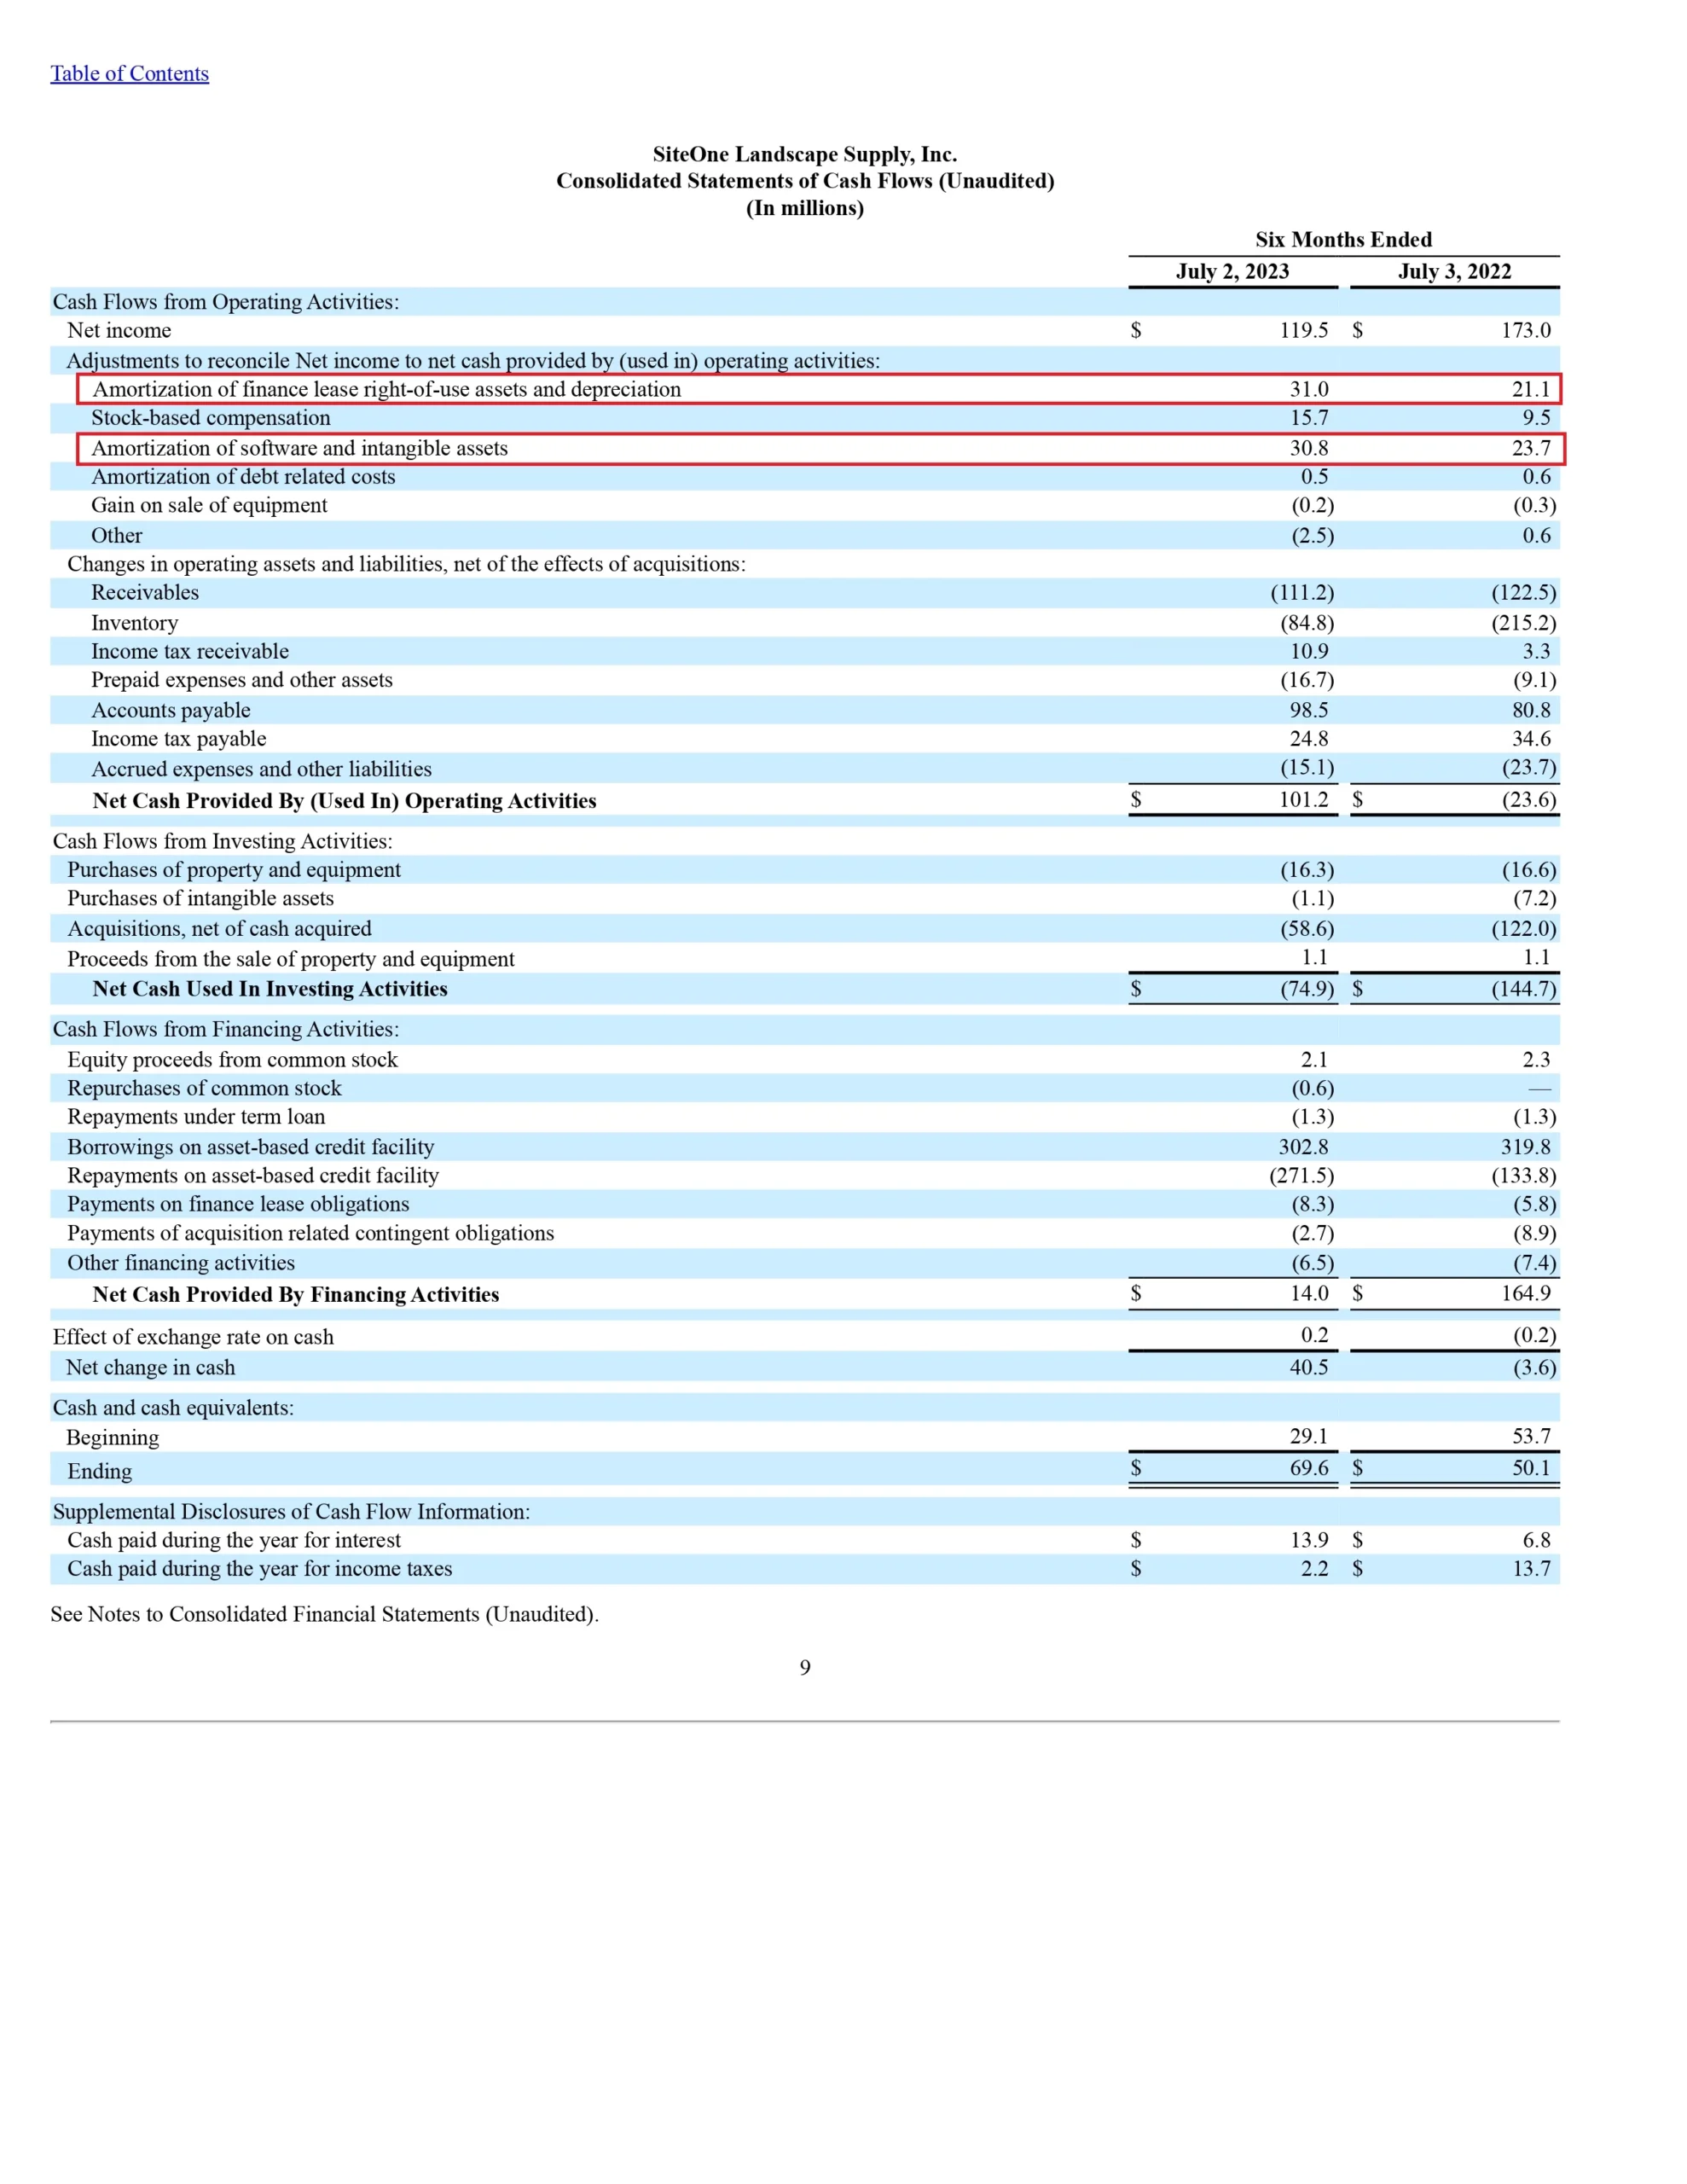
Now, visit page 68 of the 10K Report. The cash flow statement would be given there, and depreciation and amortization would be considered the 4th and 6th line items.
Amortization of finance lease right-of-use assets and depreciation = $51.6 Million
Amortization of software and intangible assets = $52.2 Million

So, the first part of the formula is:
= $464.3 Million – ($51.6 Million + $52.2 Million)
= $360.5 Million
The second one is,
6 months ending Adjusted EBITDA as of 3rd Jul’22 – (6 months ending Depreciation and Amortization as of 3rd Jul’22)
Visit page 39 of the 10Q report. The tables clearly show the values of Adjusted EBITDA, which are $67.8 Million for the first quarter and $222.0 Million for the second quarter.

Now, visit page 11 of the 10Q Report. The cash flow statement would be given there, and depreciation and amortization would be considered the 4th and 6th line items.
Amortization of finance lease right-of-use assets and depreciation = $21.1 Million
Amortization of software and intangible assets = $23.7 Million
So, the second part of the formula is:
= ($67.8 Million + $222.0 Million) – ($21.1 Million + $23.7 Million)
= $245 Million
The third one is,
6 months ending Adjusted EBITDA as of 3rd Jul’23 – (6 months ending Depreciation and Amortization as of 3rd Jul’23)
Visit page 39 of the 10Q report. The tables clearly show the values of Adjusted EBITDA, which are $39.8 Million for first quarter and $211.2 Million for second quarter.

Now, visit page 11 of the 10Q Report. The cash flow statement would be given there, and depreciation and amortization would be considered the 4th and 6th line items.
Amortization of finance lease right-of-use assets and depreciation = $31.0 Million
Amortization of software and intangible assets = $30.8 Million

So, the third part of the formula is:
= ($39.8 Million + $211.2 Million) – ($31.0 Million + $30.8 Million)
= $189.2 Million
Combining all the pieces,
LTM Adjusted EBIT = 12 months ending Adjusted EBIT as of 2nd Jan’23 – 6 months ending Adjusted EBIT as of 3rd Jul’22 + 6 months ending Adjusted EBIT as of 2nd Jul’23
=$360.5 Million – $245 Million + $189.2 Million
=$304.7 Million
Now, calculate the multiple with Adjusted EBIT.
EV/Adjusted EBIT = Enterprise Value / Adjusted Earning Before Interest and Taxes
=$1,524.49 Million / $304.7 Million
= 5.00324 x
3. EV/EBITDA = Enterprise Value / Earning Before Interest, Taxes, Depreciation, and Amortization
Since I’ve already figured out the Enterprise Value, which is $1,524.49 million, let’s now focus on calculating the denominator.
Instead of using EBITDA, we’ll use Adjusted EBITDA here. The company’s financial statements include a separate report for Adjusted EBITDA.
Adjusted EBITDA is not the same as regular EBITDA. Its purpose is to make a company’s earnings and expenses comparable by taking into account different spending patterns that various companies may have. Since we’ve already discussed the contrast between GAAP and non-GAAP numbers, we’ll use Adjusted EBITDA instead of the regular EBITDA.
The company also provides information on Adjusted EBITDA separately. To find these values, you can check pages 39 of the 10Q Report and 51 of the 10K Report. The tables display the Adjusted EBITDA values, which are $464.3 million for the 12 months ending on January 1, 2023, $67.8 million and $222 million for the first and second quarters ending on July 3, 2022, and $39.8 million and $211.2 million for the first and second quarters ending on July 2, 2023.


LTM Adjusted EBITDA = 12 months ending Adjusted EBITDA as of 2nd Jan’23 – 6 months ending Adjusted EBITDA as of 3rd Jul’22 + 6 months ending Adjusted EBITDA as of 2nd Jul’23
= $464.3 Million – ($67.8 Million and $222 Million) + ($39.8 Million and $211.2 Million)
= $425.5 million
Now, let’s put all the elements of the multiple together.
EV/EBITDA = Enterprise Value / Earning Before Interest, Taxes, Depreciation, and Amortization
= $1,524.49 Million / $425.5 Million
= 3.58282 x
4. EV/Invested Capital = Enterprise Value / Invested Capital
I’ve already figured out the Enterprise Value for Brightview Holdings. We’ll just get that number, which is $1,524.49 million. If you’re interested in learning how to calculate Enterprise Value step by step, click here.
Now, let’s proceed to figure out invested capital. As we’ve previously talked about, there are two ways to calculate invested capital.
- Operating Approach where Invested Capital is calculated using the Net Working Capital, Plant, Property & Equipment and Goodwill & Intangibles Assets.
Invested Capital = Net Working Capital + Plant, Property & Equipment + Goodwill & Intangibles Assets
Where Net Working Capital = Current operating assets – Non-interest bearing current liabilities.
- Financing Approach where Invested Capital is calculated using Total debt and leases, Total Equity and Equity Equivalents and Non-Operating Cash & Investments.
Invested Capital = Total debt & Leases + Total Equity and Equity Equivalents + Non-Operating Cash & Investments
We’ll use the first method to calculate Invested Capital.
Invested Capital = Net Working Capital + Plant, Property & Equipment + Goodwill & Intangibles Assets
Let’s first calculate Net Working Capital,
- Net Working Capital = Current operating assets – Non-interest bearing current liabilities
To find this information, go to page 7 of the 10Q Report. Look for the company’s combined balance sheet. On the 7th line, you’ll find Current Assets listed as $1,586.0 Million, and on the 24th line, Total Current Liabilities are listed as $682.9 Million.
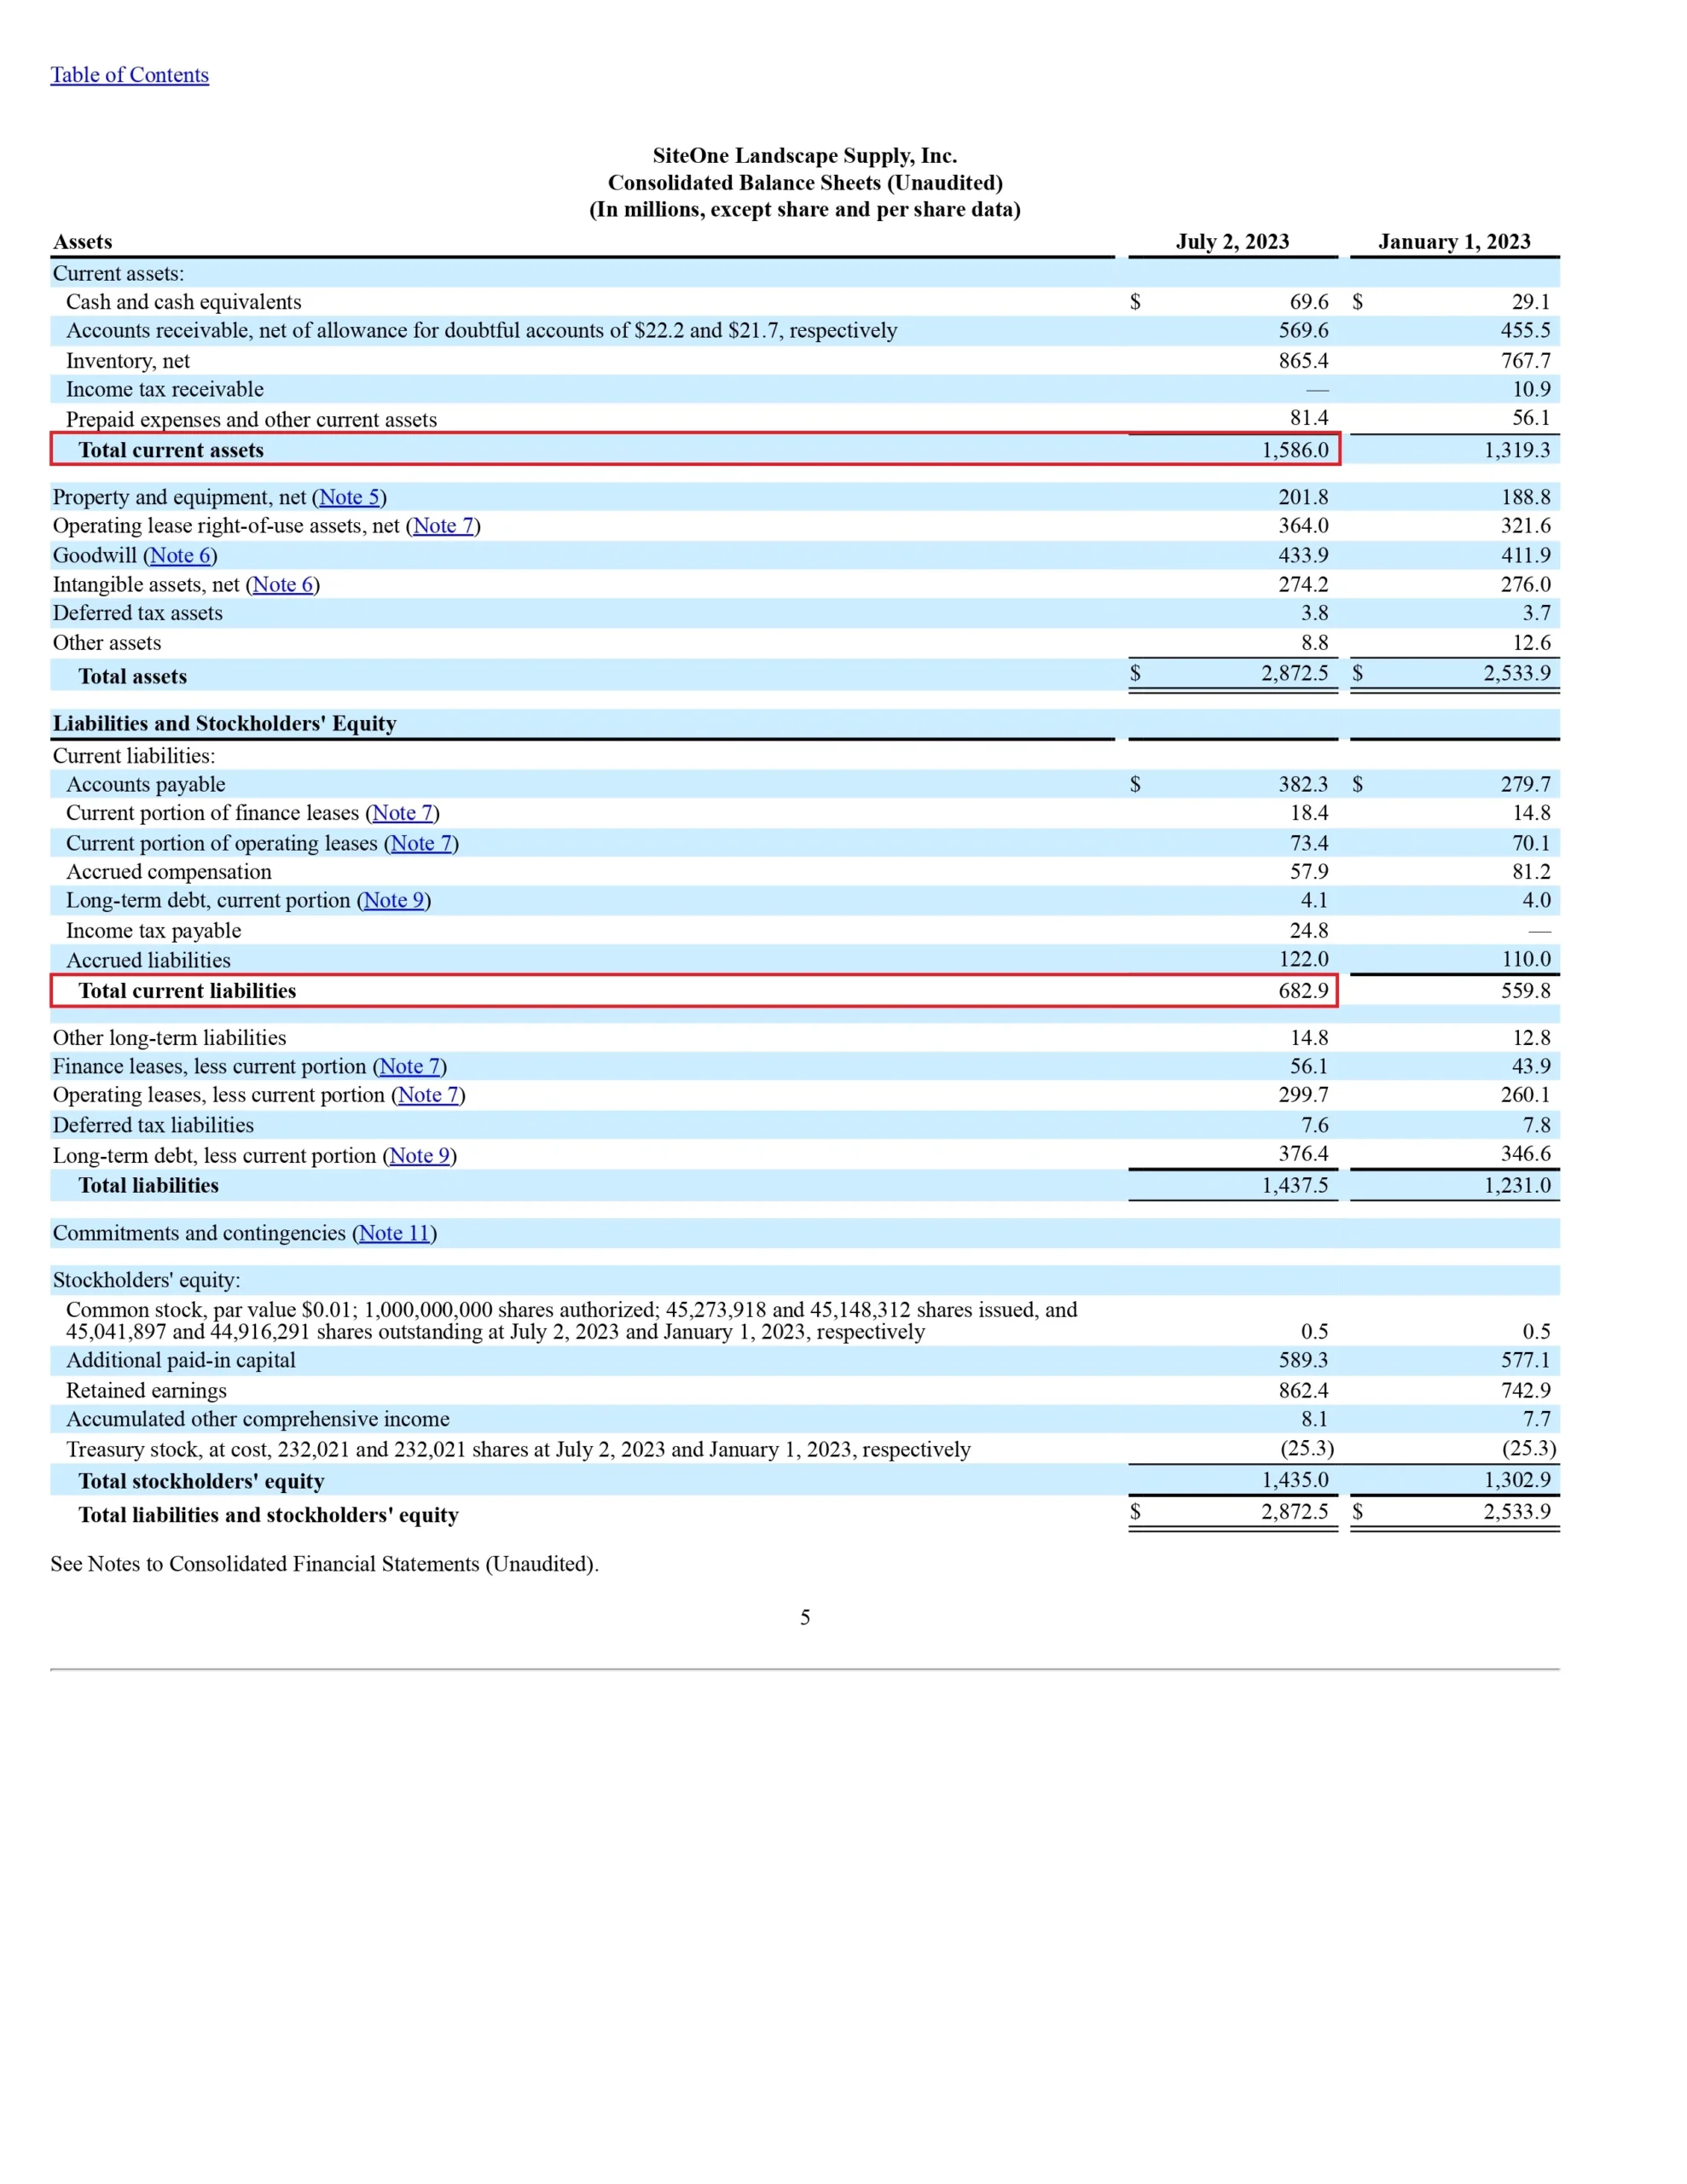
Net Working Capital for 12 months ending Jan’23 = $1,586.0 Million – $682.9 Million
= $903.1 Million
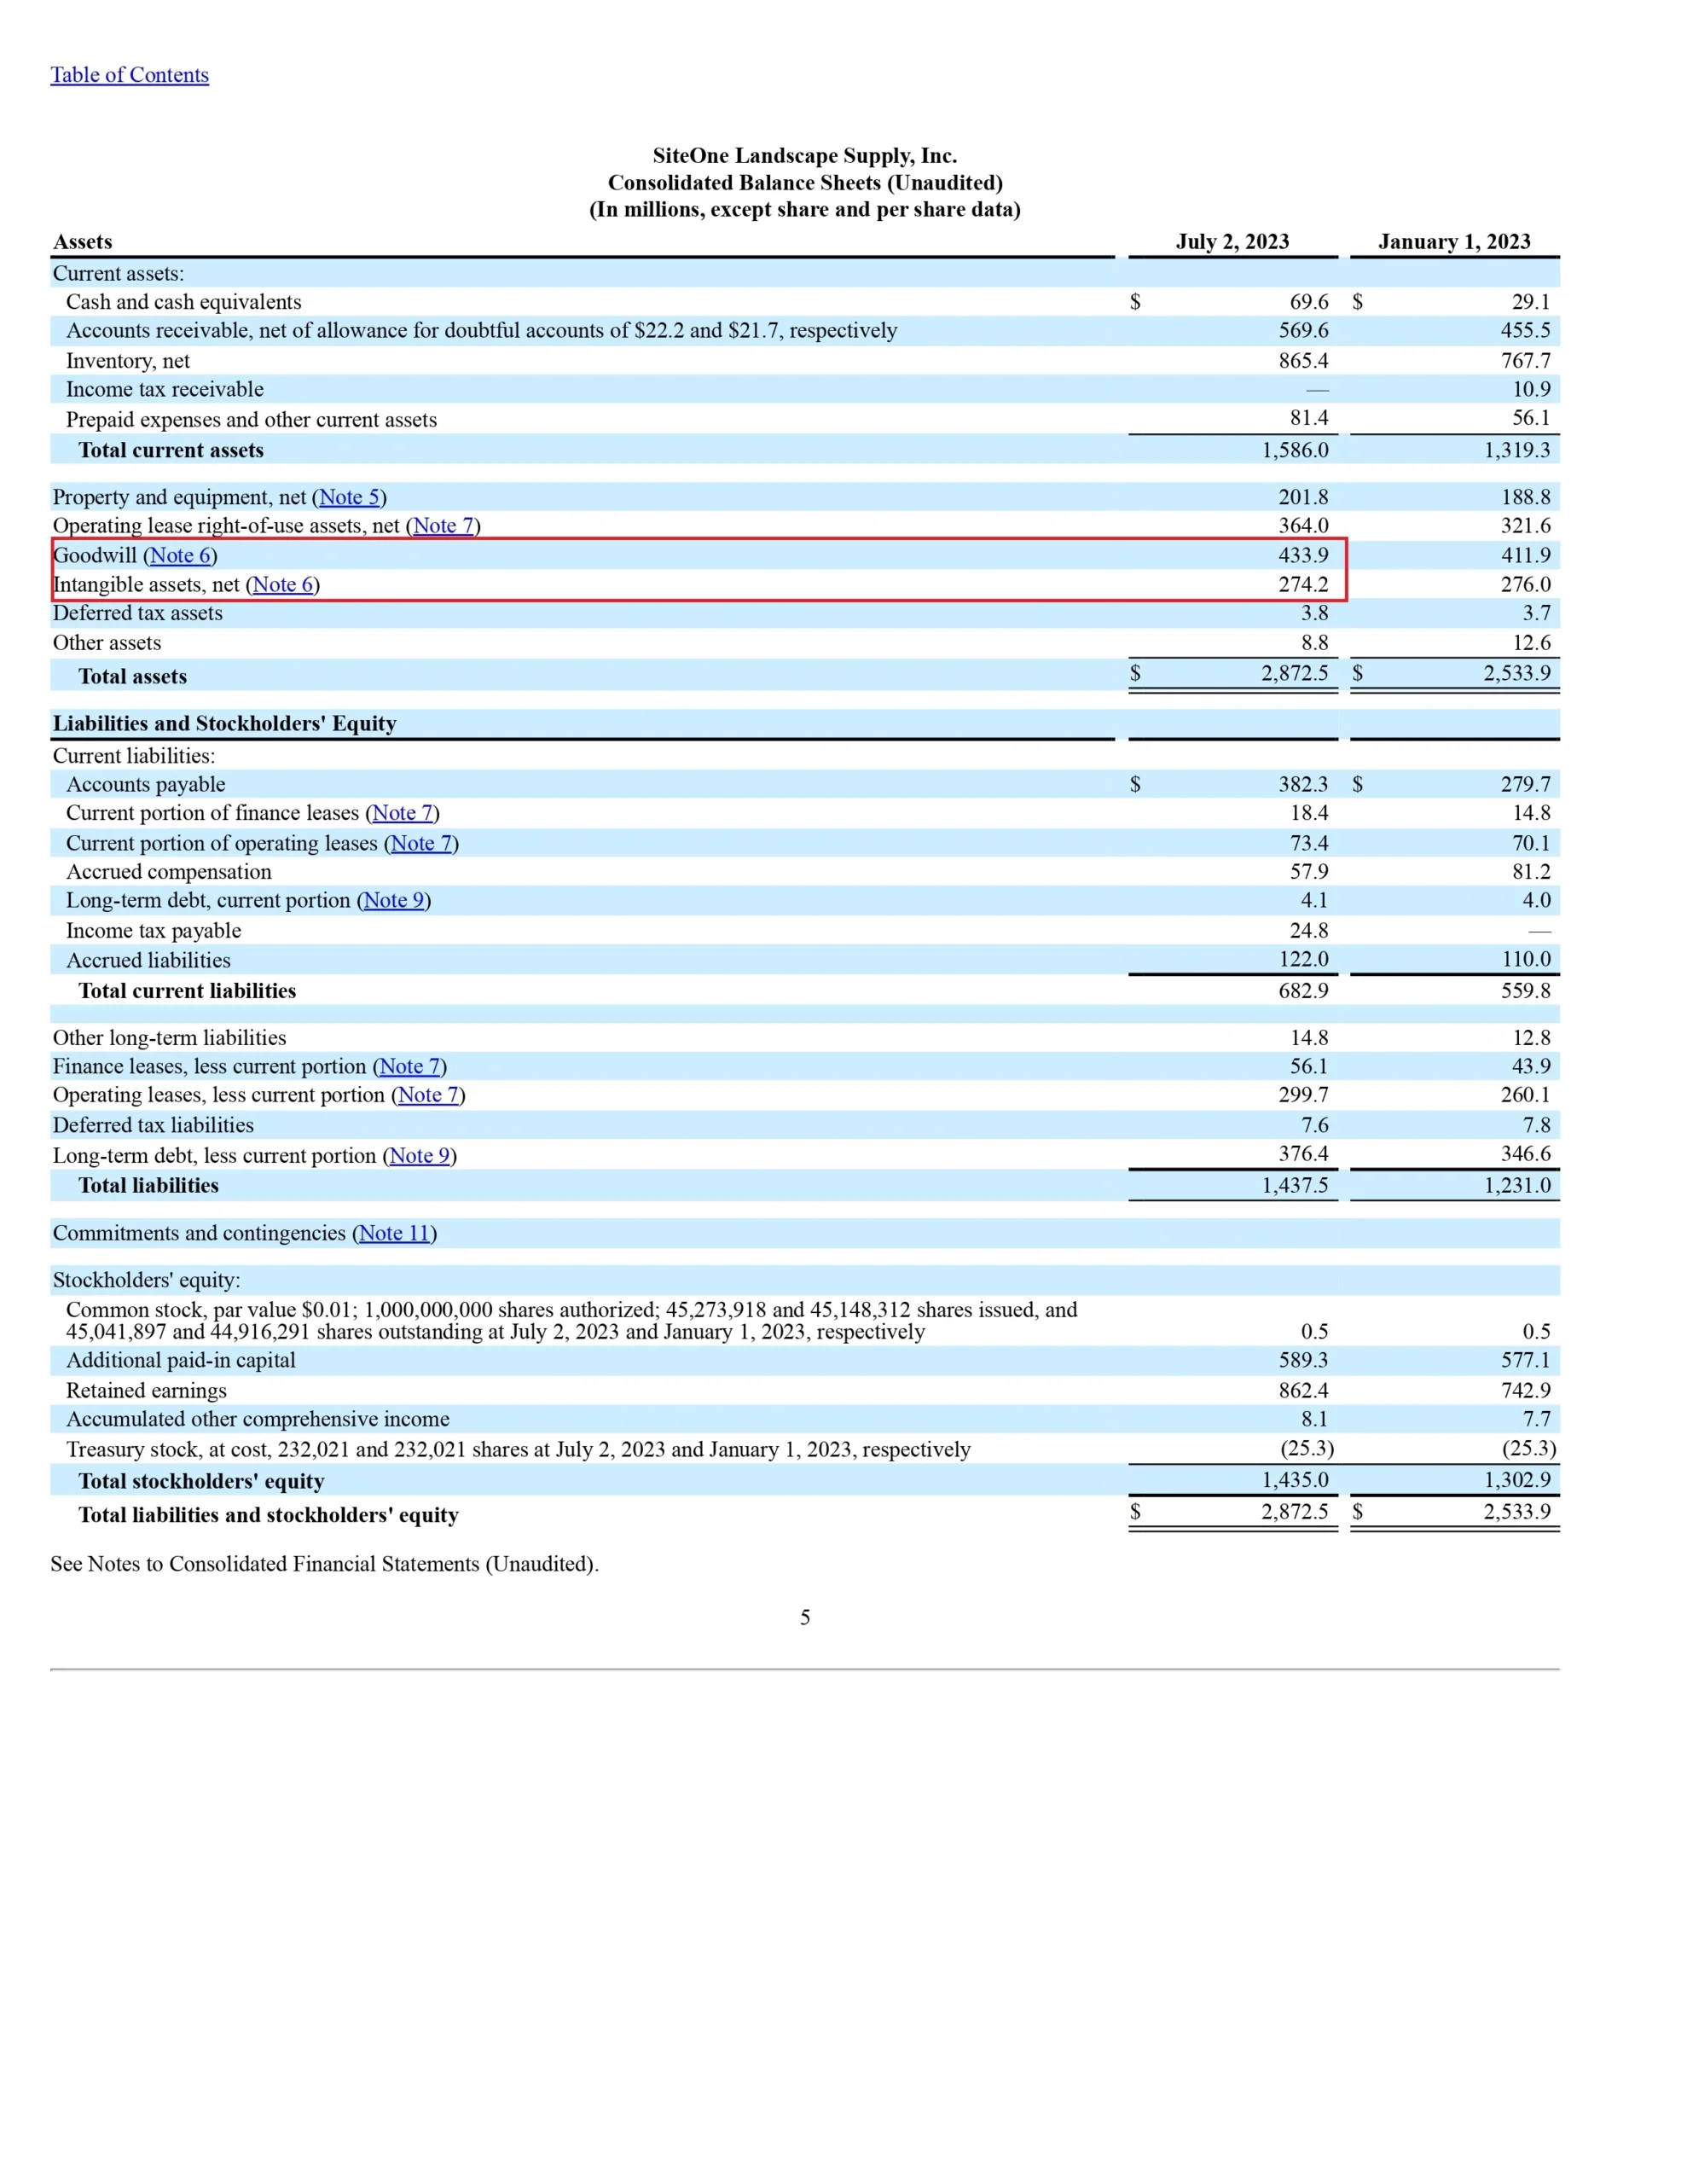
- Plant, Property & Equipment is also given in the balance sheet as the 8th line item, which is $201.8 Million. We’ll include Operating lease right-of-use assets, net also to Plant, Property & Equipment which is $364.0 Million because it is also the part of the assets which company has taken on lease for its own use.

- Goodwill and Intangible Assets are reported separately on the balance sheet itself. So we’ll add both. Values are given on the 10th and 11th line items, which are $433.9 Million and $274.2 Million, respectively. Together, they sum to $ million.
= $433.9 Million and $274.2 Million
= $708.1 Million
Now that we have everything we need to figure out the invested capital, let’s assemble the pieces.
Net Working Capital = Current operating assets – Non-interest bearing current liabilities
Invested Capital = Net Working Capital + Plant, Property & Equipment(including Operating lease right-of-use assets, net) + Goodwill & Intangibles Assets
=$903.1 Million + ($201.8 Million + $364.0 Million)+ $708.1 Million
= $2,177 Million
Now, let’s combine the values to compute the multiple,
EV/Invested Capital = Enterprise Value / Invested Capital
= $1,524.49 Million / $2,177 Million
= 0.70027 x


